


Fixed Income Insights: Asian bonds’ scarcity value emerges amid negative yields
15-10-2019
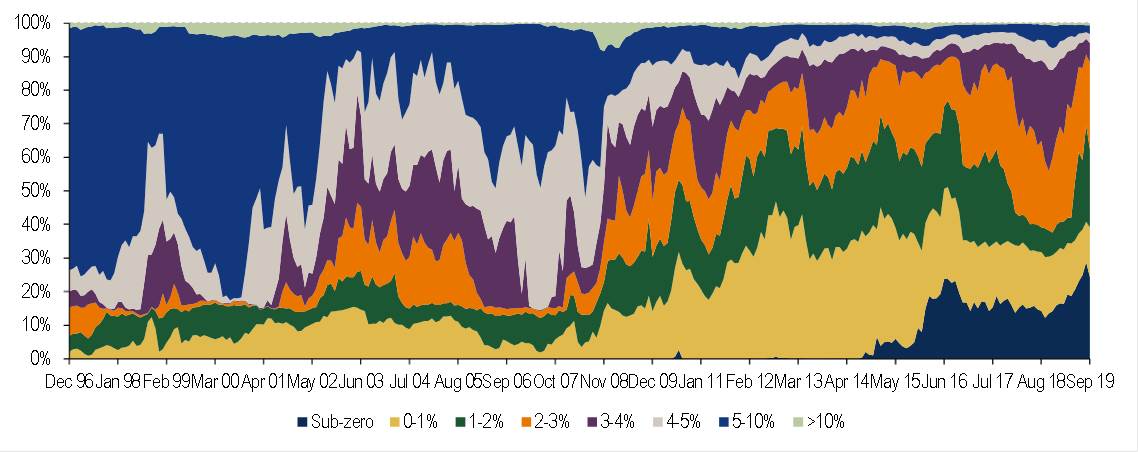
Global bond markets experienced an eventful third quarter with the 10-year Treasury yield falling below the 2-year Treasury yield for the first time since 2007. The yield curve inversion in addition to the ongoing U.S.-China trade war and weak global economic data have sent mixed signals to investors. During the period, the corporate bond market outperformed the U.S. treasury market. The markets returned to a risk-on mode in September as the U.S. postponed the next round of tariffs on Chinese goods as a gesture of good will ahead of China’s 70th anniversary. We think there’s an increased chance of avoiding a full-blown trade war, even though an eventual deal that would resolve all the trade, economic and technology-related disputes remains far off. Having said that, we think time is on China’s side, as China seeks to stimulate and promote domestic consumption to minimise the impact of rising tariffs. Conversely, the pressure is on President Donald Trump as his chances of being re-elected in the 2020 presidential election are taking a hit with the impact of the trade war on the U.S. economy and consumers. As the growing pool of negative-yielding debt reached 24% by end-September from 16% in 2018 while bonds with yields more than 5% amounting to just 3% of the global fixed income universe, we continue to think Asian bonds, especially Chinese property dollar bonds, offer good yields, high scarcity value, low default rates and solid fundamentals.
Figure 1: Asian bond indices remained resilient
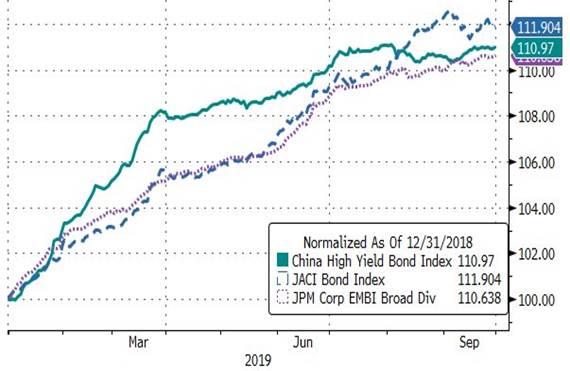
Figure 2: U.S. treasury yields are bottoming out
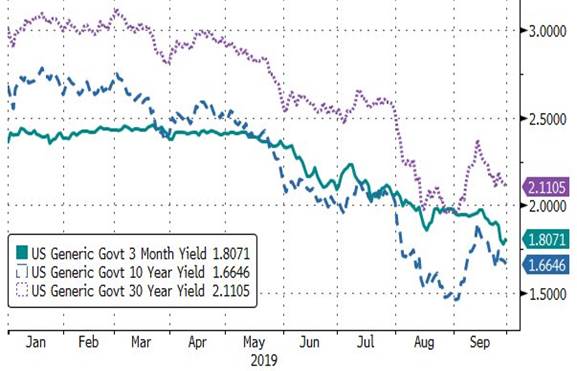
Figure 3: Bonds with yields more than 5% amounting to just 3% of global fixed income inverse
Global investment outlook
China’s Manufacturing PMI Index has been more resilient than expected as exports to countries out of the U.S. have helped to offset impact from tariffs imposed by the U.S. Meanwhile, Germany’s Manufacturing PMI and U.S. Composite PMI fell significantly amidst the global trade tension. We think there’s an increased chance of avoiding a full-blown trade war, even though an eventual deal that would resolve all the trade, economic and technology-related disputes remains far off. Having said that, we think that time is on China’s side, as the Chinese economy is supported by domestic consumption/investments, infrastructure projects and trades with other countries.
Figure 4: Resilient Chinese economy
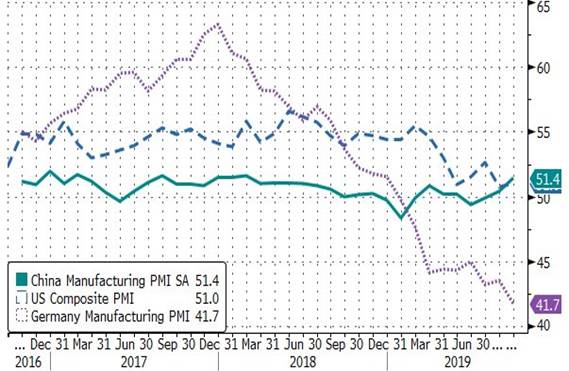
Figure 5: USD diverge from oil and copper
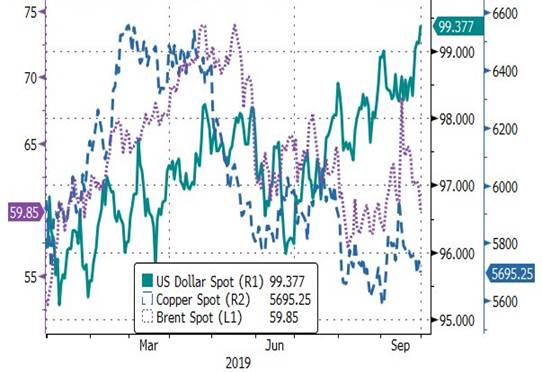
U.S. Dollar Index (DXY) strengthened in the third quarter as investors continued to flock into dollar-denominated assets, partly because of the U.S.-China trade war and rate cut actions by the U.S. Federal Reserve. However, we see a high chance of avoiding a full-blown trade war and the dollar’s strength may have been over-exaggerated given narrowing interest rate differentials. During this period, we see lower copper price as the trade war dragged on global economic growth. Copper has slid 14% from this year’s high in mid-April on the back of a manufacturing slump and concerns over major economies’ heading into recession. In Q3, oil prices were range-bound due to the impacts from the trade war, increasing U.S. shale oil production, reassurance on oil production curb by OPEC+ and coming Aramco IPO.
In terms of interest rates, we revise down our 10-year U.S. government bond yield’s year-end target to 2.1% as we think chances for a final trade deal remain unlikely in the near term. We are prepared to further revise down our target if we see the possibility of a full-blown trade war. In terms of credit risks, we continue to see low default rates in emerging markets. The view is supported by a Moody’s research highlighting the 2018 non-financial EM corporate bond default rate was only 1.4%, the second lowest figure since 2012. Asian corporates have slashed leverage metrics meaningfully in recent years and are well-positioned. However, given trade war uncertainties and global geopolitical tensions, portfolio diversification and credit selection will continue to be two of our top priorities.
Asian credits continued its rally in Q3 mainly driven by lower UST yields and spread resilience. However the divergence in performance for investment grade (IG) and high yield (HY) has shown increased caution among investors in view of various macro risks and slower growth concern. Looking at Asian countries, Indonesia and India continued their monetary easing stance and started structural reforms and stimulus in Q3. For example, Indonesia cut property and auto tax cuts and relaxed the loan to value (LTV) ratio to boost consumption. President Jokowi also planned to spend US$33bn to construct a new administrative capital in East Kalimantan. In India, the government announced bold fiscal measures including a corporate tax cut worth INR 1.45trn (~0.7% of GDP). To fund the fiscal deficits, the Indian government has completed US$10bn offshore sovereign bond issuances and targets to raise INR 10.5trn (USD 148.17bn) more via disinvestments of public sector units in the current fiscal year. In emerging markets out of Asia, disinflation trends and further easing by core central banks should facilitate easing monetary policy and external financing. The recent surge in oil prices following the attacks on Saudi Arabian oil infrastructure and political uncertainties in Argentina brought renewed volatility in emerging markets.
Chinese onshore bond market
An overview of Chinese economy and RMB bonds
In July, the Chinese government tightened restrictions on real estate financing. China-US trade friction suddenly escalated in August and subsequently, China central bank announced broad-based and targeted RRR cuts in September. As the market digested the news, the yield of 10Y CGB reached the lowest point of the year in Q3. While concerns about economic stabilisation and a spike in rate volatility intensified, interest rates of onshore bond market have become more reactive to economic data.
In terms of interest rate bonds, the bond price rose in early Q3 and then fell partly due to the trade war escalation. The 10Y CGB bond yield declined to 3.04% due to the positive outlook on economy, but the rate rebounded sharply to 3.12%. We maintain our cautious view on interest rate bonds for the rest of the year especially after what had happened to CGB bond yields in Q4 2016. On one hand, the market was running out of good news. On the other hand, most investors expect that the economic stabilisation and the rise in inflation will be consolidated.
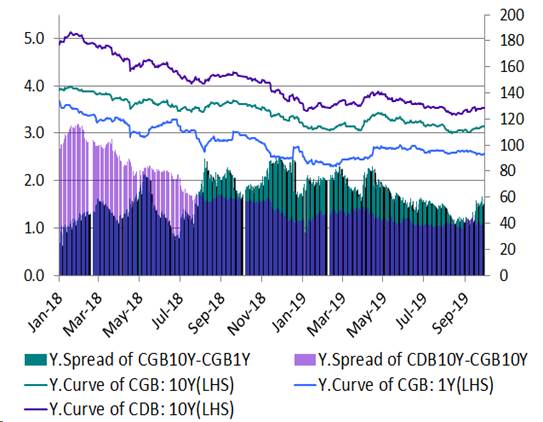
Figure 7: Chinese onshore credit bonds
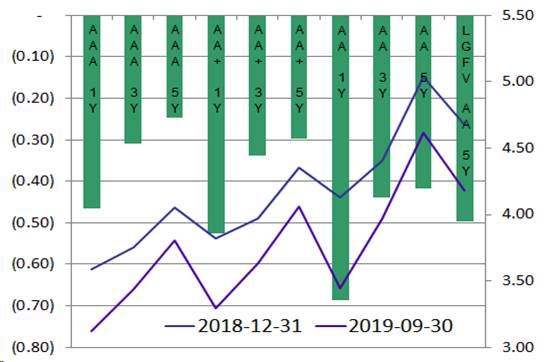
In terms of credit bonds, the supply of new issuance continued to increase in Q3, with a significant increase compared to the same period in 2018. The net financing of some low-rated companies has recovered, but it was still negative for non-state-owned enterprises. The default rate decreased slightly in Q3. The default rate of entire credit universe was 1.01% while the default rate of private enterprises was much higher at 8.03%. Sector-wise, the risk of real estate rose slightly; the spread of LGFVs continued to differentiate between good and bad credits; and private enterprises’ credit quality continued to deteriorate.
Fourth quarter outlook
As more countries have begun to cut interest rates and as the pool of negative-yield assets expands, RMB bonds. which offer higher yields, have become more attractive compared to other emerging market bonds. We expect to see less policy reaction in Q4 as policy makers have implemented quite a number of policies year-to-date. Hence, we do not expect further loosening in China’s monetary policy in Q4. Having said that, we understand that the government is considering the advance issuance of 2020 special bonds quota in Q4 to support a new round of infrastructure spending. Overall, we prefer short term opportunities in interest rate bonds and are cautious of long-term holdings. In terms of credit bonds, Q4 will be the peak maturity period for industrial bonds. Therefore credit selection would be crucial to us during the quarter and we might see credit spread widening in Q4.
Chinese offshore bond market
The property sales in Q3 showed strong resilience with more new launches offsetting a milder sell-through. National sales in 8M19 growth was 6.8% YoY (7M: 6.2%), while the preliminary September sales for listed names we track posted a strong 29.0% YoY growth, bringing their YTD sales growth (9M19) to +17.0% YoY (8M: +16.0%). Despite Q3 sales weakened slightly from Q2, the listed developers still recorded 30%+ YoY growth vs. Q3 in 2018. We expect the sales resilience to remain in Q4 mainly due to the accelerating new launches from sales campaign in Q4, resilient demand in Tier 1/2 cities and flexible pricing in Tier 3/4 cities. Despite seeing more pressure in Tier 3/4 cities, we expect the developers to use various ways to boost sales including targeted price discounts (3.0-5.0% and mostly in form of changing from fitted units to bare shell units) and flexible payment terms.
In response to the tightening policy on property related financing, we do see pressure from longer development loan approval process, tighter mortgage loan quota and halt of trust loan lending for land purchase. That said, we have not seen material increase of mortgage rates or funding cost and banks showed clear preference in lending to the quality developers and projects in prime locations. Therefore, we expect the top and quality developers, as well as the ones with strong local footprint to benefit from this round of tightening. Besides, we expect the land price to trend down towards end of the year, and that would provide a good window for selective developers for land replenishment. In terms of refinancing risk in H2, we continue to think that it would be manageable for the sector given the significant amount of front-loaded financing in H1.
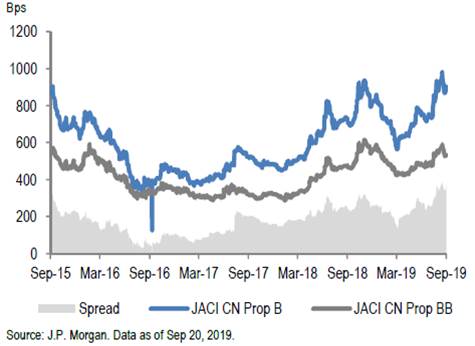
In terms of valuation, China HY property spread pick-up over U.S. HY has gone up back to 278bps as of mid-Sept after the material compression in H1. Meanwhile, the spread for JACI CN Property B vs JACI CN Property BB was around 369bps, which is almost the historical high since Sept-2015 and vs. the LTM average of 259bps or LTM low of 138bps. Despite recognising the challenging macro backdrop as well as the concerns over a slower economic growth and weaker currencies that could continue to cast shadows over the lower-rated credits, we believe the fundamentals remain largely resilient for majority of the credits in China property sector, therefore we would expect the valuation to revert back to normalised space along with risk sentiment improvement.
Figure 8: Net increase of property loan as % of total RMB loan
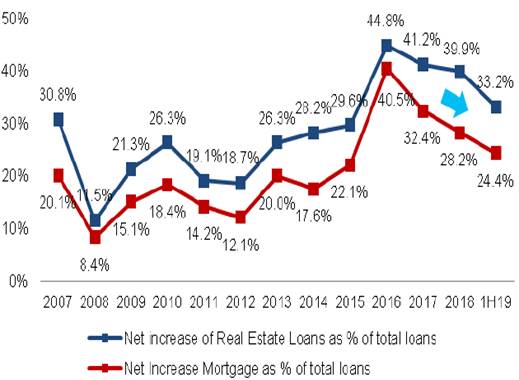
Figure 9: JACI CN Prop B vs JACI CN Prop BB
In the China industrial space, we continue to stay cautious as it is a very much headlines driven segment of the high yield market. At the moment, we try to stay light in the space and stick to BB rated names.
Special topic – What causes oil prices to fluctuate?
Global oil production and OPEC+ influence prices
OPEC+ refers to Organisation of Petroleum Exporting Countries’ (OPEC) cooperation with non-OPEC oil producers e.g. Russia, Kazakhstan, Azerbaijan and Mexico to effect production cuts since late 2016. In December 2018, OPEC+ countries decided to cut production by 1.2 mln barrels per day (bpd) from the level of October 2018. In September 2019, the Saudi and Russian energy ministers called on all OPEC+ producers to comply with oil production cuts under the OPEC-led supply agreement. OPEC has cut production by 2.3 mbpd while Russia reduced around 350 kbpd since the end of 2018. Back in December 2018, OPEC+ contributed more than 45% of global crude oil production. Market generally believes that Saudi Arabia is in a rush to boost oil prices as it gears up for Aramco IPO. We understand that Saudi’s oil policy remains in place despite the recent change in the kingdom’s energy minister.
Figure 10: OPEC+ production fell significantly
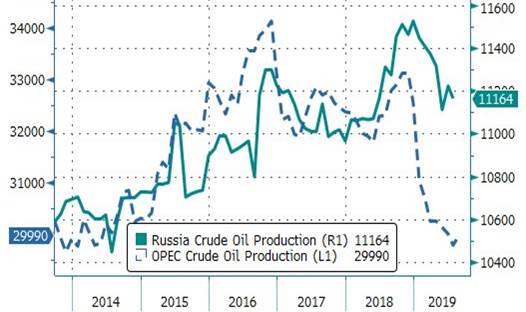
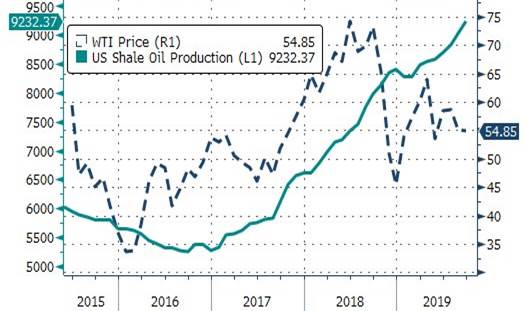
Figure 11: Shale oil production rose together with WTI
Impact of U.S. shale oil revolution on the global oil market
In 2013, U.S. shale oil production was projected to increase from about 1 mbpd to 2 mbpd in 2020 while possibly reaching 3 mbpd by 2025. Today we see more than 9mbpd in U.S. shale oil production after the recent round of U.S. shale oil production expansion between 2016 and 2019. However, oil prices, interestingly, went up during the same period. In December 2018, even the International Energy Agency (IEA) agreed that U.S. shale oil forecasts were too optimistic and there are a small group of oil industry insiders believe that the shale oil expansion has been overhyped and that some of the most lucrative shale wells may have already peaked. Earlier this month, shale pioneer Mark Papa, the founder and former chairman and CEO of EOG Resources, sees U.S. producers exhausting prime drilling spots in key oil regions like the Permian Basin and Eagle Ford, having a “profound” effect on production and global crude prices. He was one of the first senior executives to highlight the problem of reduced output when a new well was drilled too closely to an existing one, known as the “parent-child well” effect, which we have been highlighting to our investors since our fixed income quarterly report started.
Natural disasters and geopolitics weigh
Natural disasters are another factor that can cause oil prices to fluctuate. For example, when Hurricane Katrina struck the southern U.S. in 2005, affecting 19% of the U.S. oil supply, it caused the price per barrel of oil to rise by $3. Geopolitics in regions like the Middle East, Venezuela and Nigeria caused oil prices to fluctuate too, as these regions account for the lion’s share of the worldwide oil supply. For example, Brent prices spiked as high as 19% in September 2019 the next business day after a drone strike on a key facility, cutting Saudi Arabia’s production by half, pulling some 5% of world supply off the market. One of the recent concerns of oil market is potential removal of the U.S. sanctions on countries like Iran and Venezuela which would bring down oil prices in a short period. However, we think the latest drone attack on Aramco’s oil production facilities which caused a shutdown of 50% of Saudi’s production would reduce the chance of Iranian sanction removal.
Global economic growth and alternative energy
Economic growth is a factor that positively corresponds with the oil price. When the economy grows, oil demand in our daily lives as well as demand to cope with economy expansion will increase. If the world’s production is unable to meet the growth, the oil price will definitely on a rise. Although global growth remains subdued, the IMF still expects global growth to be 3.2% in 2019, picking up to 3.5% in 2020. The discovery and technology development to explore other alternative energy sources to substitute oil at competitive prices and efficiently meet the consumers need will decrease the demand for oil. As long as the technology and development remains limited, the oil price will fluctuate and depend on the imbalance between demand and supply. In BP’s latest Energy Outlook (2019-2040) report, demand for oil and other liquid fuels are expected to grow for the first part of the Outlook period before gradually plateauing. Renewable energy and natural gas are expected to grow robustly while global coal consumption is broadly flat.
Figure 12: Economic and market data
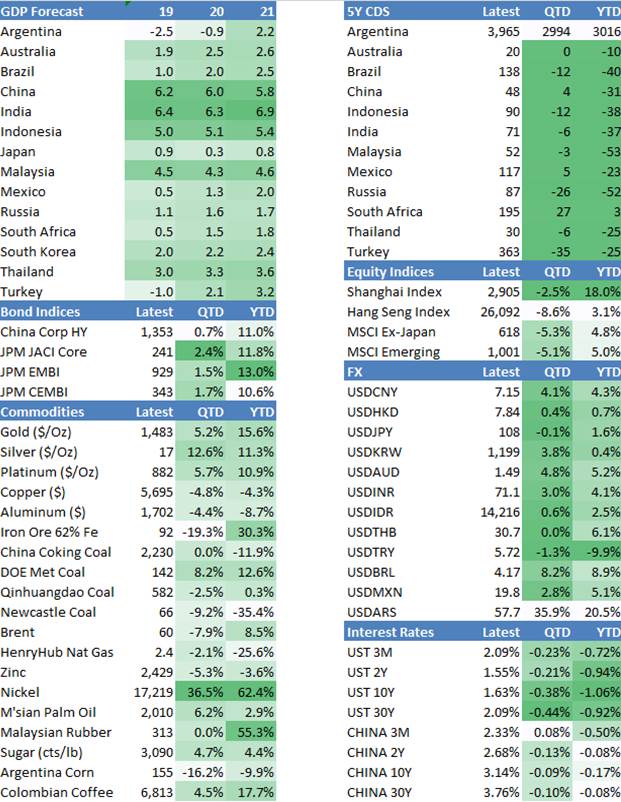
*Source of data/charts: ICE/BAML, Bloomberg, JPMM.com, Chinabond.com.cn, Peakoilbarrel.com and Value Partners internal resources, 1st Oct 2019
The views expressed are the views of Value Partners Hong Kong Limited only and are subject to change based on market and other conditions. The information provided does not constitute investment advice and it should not be relied on as such. All material has been obtained from sources believed to be reliable as of the date of presentation, but its accuracy is not guaranteed. This material contains certain statements that may be deemed forward-looking statements. Please note that any such statements are not guarantees of any future performance and actual results or developments may differ materially from those projected.
This commentary has not been reviewed by the Securities and Futures Commission in Hong Kong. Issuer: Value Partners Hong Kong Limited.
For Singapore investors: This commentary has not been reviewed by Monetary Authority of Singapore. Value Partners Asset Management Singapore Pte Ltd, Singapore Company Registration No. 200808225G.